Warning: Use of undefined constant THEM_TEMPLATEURL - assumed 'THEM_TEMPLATEURL' (this will throw an Error in a future version of PHP) in /www/wikina.de/wikina.de/domains/qed.wikina.org/wp/wp-content/themes/panorama/functions.php on line 5

Warning: Use of undefined constant AP_LAYOUT - assumed 'AP_LAYOUT' (this will throw an Error in a future version of PHP) in /www/wikina.de/wikina.de/domains/qed.wikina.org/wp/wp-content/themes/panorama/functions.php on line 38

Warning: Use of undefined constant AP_LINKCOLOUR - assumed 'AP_LINKCOLOUR' (this will throw an Error in a future version of PHP) in /www/wikina.de/wikina.de/domains/qed.wikina.org/wp/wp-content/themes/panorama/functions.php on line 39

Warning: Use of undefined constant AP_HOVERCOLOUR - assumed 'AP_HOVERCOLOUR' (this will throw an Error in a future version of PHP) in /www/wikina.de/wikina.de/domains/qed.wikina.org/wp/wp-content/themes/panorama/functions.php on line 40

Warning: Use of undefined constant AP_HEADERIMAGE - assumed 'AP_HEADERIMAGE' (this will throw an Error in a future version of PHP) in /www/wikina.de/wikina.de/domains/qed.wikina.org/wp/wp-content/themes/panorama/functions.php on line 41
QED | The Strange Theory of Light

Kategorie: QED

Light – discussion

From Mamxwell’s equations for the speed of light in vacuum we can derive the formula c0 = (ε0μ0)-1/2, where ε0 and μ0 are the permittivity and permeability of vacuum. Maxwell’s equations and the derived results are exactly valid only for vacuum, of course. To extend Maxwell’s equations likewise to a medium, empirical material coefficient of relative permittivity εr and of relative permeability μr are defined. Using them the hypothetical speed of light takes the form
c = (εrμr)-1/20 μ0)-1/2. Refractive index n is defined as a ratio of speed of light c0 in vacuum to that c in a medium n = c0/c, so that refractive index of a medium takes the hypothetical value of n = (εrμr)1/2.

Permeability μr = 1 and permittivity εr = 81 are the values for water found with static electrical measurements. So, calculated hypothetical value of refractive index is n = 9, but an experimental value is n = 1,33. Great discrepancy between the hypothetical and experimental values has its explanation in a groundless extrapolation of the relative permittivity for light.

We illustrate the relative permittivity in Fig. 23. The greater circles depict the free charge Q originated from the voltage source V. Between the two electrodes there is a dielectric, which is represented by its dipoles illustrated by small circles. Dipoles are polarised by an applied electric field of intensity E0 originated by a free charge Q. Inside the dielectric body, charges of dipoles mutually cancel their effect. At the electrodes the dipole charges (labelled bound charges) are uncompensated and create field of intensity Ed, which together with E0 forms the final intensity E = E0 – Ed.


Fig. 23 Relative permitivity εr

As the bound charges weaken the effect of the free charges Q, the size of Q is larger than it would be q in case of absence of the dielectric. The material constant of the relative permittivity is the ratio of the free charges between two electrodes with dielectric and without it εr = Q/q.

Per definition, photon travels at a speed c0 of light in vacuum. Its path in a material takes a zigzag form due to the interaction between the photon and electrons and the average time of travelling is prolonged. This is the reason why the speed c of light is slower in a material.

At last it should be sad why the relation c0 = (ε0μ0)-1/2 is valid exactly. This relationship, which can be derived from the Maxwell’s equations, has been recommended (1948) as a definition for the vacuum permittivity within the SI system of units by The General Conference on Weights and Measures (Conférence Générale des Poids et Mesures, CGPM) and has been legitimised in most of states. The value of permittivity results from the following decisions:

a) The current unit Ampere is defined as “the constant current that will produce an attractive force of F = 2 × 10⁻⁷ newton per meter of length between two straight, parallel conductors of infinite length and negligible circular cross section placed one meter apart in vacuum”.

b) The rationalised form of Maxwell’s equations is legitimised. Here the permeability of vacuum acquires value of μ0 = 4π10-7 [mkgs-2A-2], which follows from the Ampere’s force law
F = μ0 I1I2L/2π when the above quoted force F is substituted.

c) The value of the permittivity makes up from the equation
ε0 = (μ0c0)-1/2 = 8,854 10-12 [kg-1m-3s4A-2].

The vacuum permeability μ0 and the permittivity ε0 are measurement system constants, they do not describe a physical property of the vacuum. Their value is determined by above quoted decisions. Only their product ε0μ0 is a physical constant that can be measured because it is tied to speed of light by the equation c0 = (ε0μ0)-1/2.

Interference – discussion

The graph of interference pattern, computed by the sum-over-paths method, refers to the probability that a photon falls at a given point of detector. Thoughtful reader may object that one photon cannot create an interference pattern, which is spread along the detector, as probability per definition is the ratio of favourable cases to all possible cases. From this it follows that interference pattern is the result of striking by a lot of photons.


Fig. 21 Double slit interference pattern for 50 photons per detector point (interference-discussion.exe)

With the program (interference-discussion.exe) (Fig. 21) we simulate the creation of interference pattern in the following way. Given a source, which emits photons one by one like a machine gun. The starting phase of a vector, the slit passing through and the endpoint on the detector are generated with a random number generator. Each photon leaves his imprint on the detector point. As any photon is represented by its vector, it is natural that his imprint is registered in a form of a contribution to the vector sum of previous photons. An idea of photon imprint is a mysterious idea, but not more then a photon passing simultaneously through two slits.

The shape of the interference pattern varies with the number of photons striking the detector (Fig. 22). One photon per a detector point is not able to create a structured pattern what means that each point has an equal chance to be hit by a photon. With growing numbers of photons the interference pattern limits to the form that is the same as calculated by the sum-over-pats method.


Fig. 22 Interference pattern related to the number of photons per detector point. (interference-discussion.exe)

We may say that the sum-over-path method makes use of statistical results attained by the “machine gun model” and it relates they to one photon. This approach is similar to the die rolling when from the statistical distribution of their outcomes we conclude that the probability of a favourite result is 1/6 for one roll. We are aware that there remains an open question how the atoms save the photon “imprints” in the form of vector sum.

Let the things are the way or another way, behaviour of subatomic particles is mysterious for a man whose thoughts has been formed in a world of objects moderate in size and velocity. Nevertheless, sophisticated experiments speak in favour of photon passing two slits simultaneously. In the section Interference we offer Feynman’s probabilistic explanation of these experiments.

Holography

Computer-aided simulation contributes to understanding Nature’s performance of its magic, as in the simulation we can follow the process step by step. The QED method makes use of the interference as the only phenomenon, which under specific circumstances is labeled as diffraction, refraction, reflection, dispersion and so on. The sum-over-paths method consists essentially of calculating the path length and the vector addition. The purpose of the holography animation is not to show the virtual object seen by an observer, but to illustrate the reconstructed field of the light through the hologram in confrontation with the original field scattered through an aperture.

In the framework of the wave theory, the monochromatic light wave is characterized by an am-plitude and a phase of a vector in every point of the light field. The classic photography records only amplitude of the wave, therefore the viewer can perceive only a flat picture without parallax.

Holography is a method of recording the complete information about the light field at a photographic plate. It means that both amplitude and phase of the wave are stored. So recorded picture is the hologram with which an observer can view an image with all of its three-dimensional details with parallax. It is impossible to recognize the scanned object on the hologram, because it is a record of interference pattern of dark and bright lines of so high density, that the naked eye cannot even distinguish them.

Fig. 18 illustrates the process of recording an object and viewing its virtual image through the hologram. An essence of the hologram recording involves the simultaneous illumination of the object with the illumination beam and the photographic plate with the reference beam of a coherent light. From the object scattered beam and the reference beam produce the interference pattern on the surface of a photographic plate – called as hologram. Laser is the best source of a perfect coherent light. The resolving power of the photographic plate must be extremely high – 5000 lines per millimeter for the visible light.
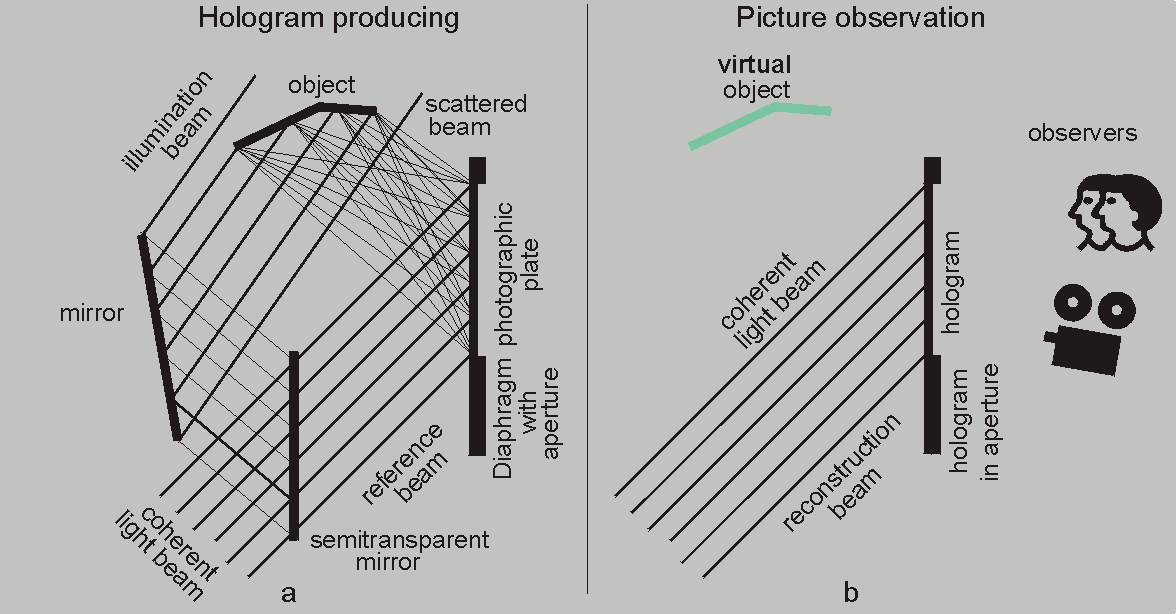

Fig. 18 Holography in framework of wave theory

A holographic image can be seen when the hologram is illuminated with a reconstruction beam, which reconstructs the light field and the observer or any photographic instrument can see and record the three-dimensional picture.

The framework of a hologram making shown in Fig. 18 is not the only acquisition; nevertheless it is a good example for an illustration of the holography by computer-aided animation based on the sum-over-paths method. In this theory, a photon is the light carrier with its strange features. The photon travels over all alternative paths from the source to the detector and here it is able to produce an interference pattern when the paths cross each other at an angle. In the graphical illustration all paths are drawn as straight lines. Photon is thought as a vector, which rotates at the frequency of light along the paths.

After this short hindsight into the strange theory of light, we explain the computer-aided animation by means of Fig. 19. As mentioned above, the purpose of the animation is not to perform the picture as observers see it, but to illustrate the field of light reconstructed through the hologram in confrontation with the original field scattered from the object through the aperture. The field is illustrated by an interference pattern, which represents the probability that the photon hits the detector or the photographic plate. The pattern magnitude in any point is proportional to the squared length of the vector sum in the given point.

The object to be displayed is a small pill – one point in the area on which ends only one path. The photon vector explores all scattered paths from the object to the aperture. The reference paths also pass trough the aperture. The sum of all vectors produces an interference pattern at the aperture (Fig. 19b). When here deposited photographic plate is irradiated by many photons, then they produce alternating gray lines in a range of black and white proportionally to the interference pattern value. Hologram is the result of this process. Hereafter in our text the interference pattern at the aperture will be referred to as a hologram.

The photon vector continues its rotating travel from each aperture point to each point of the detector. These paths are not shown in Fig.19. The second bottom figure (Fig. 19c) illustrates the interference pattern of the aperture (without hologram) on the detector. This pattern represents the original light field, which is compared to the reconstructed one.

In the third bottom figure (Fig. 19d) we see a fragment of the interference pattern of the photon traveling over reference paths trough the aperture to the detector directly. It is the interference pattern of the aperture – similar patterns can we see in the programs diffraction-aperture.exe or dispersion.exe. The aperture pattern reaches the detector with its “fringes” in spite of that the illuminated area is high above the detector according to the rules of geometric optics.

If a hologram is deposited into the aperture then the length of vector rotating along reference paths is modulated by the hologram. It means that the magnitude of the vector is multiplied by the value of the interference pattern in the aperture. The hologram acts as a tailor-made grating for the object. The modulated vector continues its rotating travel over all paths to the detector to create here the interference pattern of the reconstructed field. The similarity of the reconstructed and original interference patterns demonstrates that the field of light is successfully reconstructed (Fig. 19e). The observer cannot distinguish whether is he seeing the real object or only its image.


Fig. 19. Computer animated holography (holography.exe)

A holographic picture can be viewed even with a monochromatic light, whose frequency differs from that one which had been used for making the hologram. In this case the observer sees virtual object not only in altered colour, but also in another size. In case that the reference light frequency is lower (higher) then the hologram making light frequency, an observer records a grater (smaller) size picture. Hologram acts as a lens, which shows the size of the picture as greater (smaller) in proportion of the reference and the reconstructing light frequency. At the first glance it may seem that viewing the picture in an enlarged size with a longer wavelength is a paradox. Nevertheless holography together with technological progress provides the possibility that objects whose hologram has been produced with X-rays could be observed with visible light in three-dimensional views. Here we cannot model this phenomenon, but the following reasoning perhaps clarifies it.

We have drawings of an object where the dimensions are reported in centimetres L1. The drawing is an analogy to the hologram. Exactly according to the data in the drawings the object is reconstructed, but this time the measuring unit is the length L2 (meter/millimetre). In this case, the copy of the object has a larger (smaller) size compared to the original plan in proportion of L2/L1. The reconstructed object corresponds with the holographic picture.

The wavelength is the measuring unit in holography animation by the sum-over-paths method, where wavelength corresponds with the distance that the photon travels during one cycle of its frequency. Fig. 20 depicts the interference pattern where the hologram is illuminated by a light of a higher (blue – Fig. 20a) or a lower (red – Fig. 20b) frequency as has been the hologram processing one (green). In accordance with the analogy of the preceding paragraph this implies that the virtual picture reconstructed with the blue (red) light is smaller (greater) than is the virtual picture reconstructed with the green light.


Fig. 20 The frequency of light divers for hologram producing and for field reconstruction

Even a fragment of the hologram allows us to view the picture, naturally as though an adequately reduced aperture. Holograms in the Fig. 19 can be considered as a fragment of a larger hologram.

Holography is exercisable in a wide range of disciplines starting with art, security, science and so on. Holography dates from 1947. Dennis Gabor, the British/Hungarian scientist, had invented the holography while working to improve the resolution of an electron microscope. For inventing holography, Gabor (born in Budapest in 1900, original name Gábor Dénes) received the 1971 Nobel Prize.

Parabola

Mirror is any surface reflecting light. As light is an electromagnetic radiation in the visible range of waves, the conclusions derived from analyses of parabolic mirror are true for communication antennas as well. Only the size of an antenna must be tailored to wavelength of the radiation.

The white lines in Fig. 17 illustrate the rays of the light. The parabolic mirror is illuminated by a plane wave and the reflected rays concentrate in a point on the axis of the mirror. This point is labelled as focus. The reflection obeys the low of geometric optics: the angle of incidence equals to the angle of reflection. As all the rays meet in one point on the mirror axis, the focal length is independent on the aperture of the mirror.

Geometric optic does not solve the distribution of the light along the axis in a vicinity of the focus. Distribution of light along the axis is solved by the QED sum-over-paths method. The paths of photon are shown in Fig. 17 as black lines only for segments parallel to the mirror axis. The paths from parabola to points on axis can be easily imagined. The parabolic mirror focus is the point on the optical axis where the probability of hitting the axis by photon acquires the maximum.


Fig. 17 Probability pattern for low (red), middle (green) and high (blue) frequency (parabolic-mirror.exe)

There are shown three probability patterns for lights of red, green and blue frequencies in Fig. 17. As the photon travels over paths always in the same medium, no dispersion effect takes place and the focuses are not separated in contrast with the focuses separation by lens. Nevertheless, the width of the probability pattern is getting larger with decreasing photon frequency. A focus calculated by the sum-over-pats method is consistent with the focus computed according to the reflection postulate of geometric optic.

Parabola is defined by the equation x = Ky2. The parameter K is optional in the program parabolic-mirror.exe and defines not only the curvature of the parabola but the focal distances as well. With enlarging K the focal distance is shortening and the probability pattern is getting narrower.

Lens

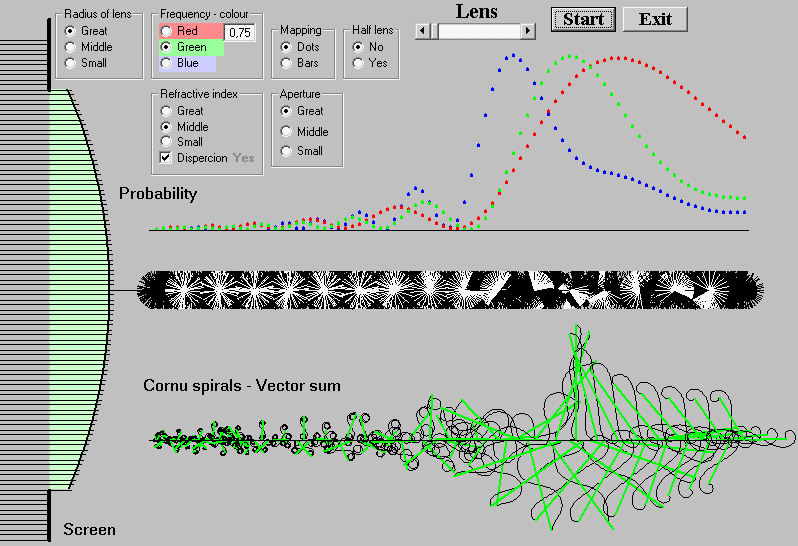
Geometric optics define a focus as a point at which rays meet after refraction in lens when the incoming beam makes a zero angle with the axis of the lens. From the viewpoint of the sum-over-paths method, a focus is a point in which the probability of hitting the lens axis by photon reaches the maximal value when photon incident paths are parallel to the lens axis (Fig. 16).

To compute the length of the photon path, the slower speed of light in lens is taken into account by multiplying the path segment in the lens by the refractive index n of the lens substance. At the focus all paths should have the same length to be achieved that all photon vectors point to the same direction and the vector sum to acquire the maximal value (we remind that square of the vector sum is the measure for probability). Parabolic shape of lens fulfils these conditions. Spherical form is a good approach to an ideal shape, but it is not the best one as it appears in the camber form of Cornu spiral in focus (Fig. 16).

The above-mentioned insufficiency of spherical lens can be made less by an aperture taking smaller (lens.exe), which excludes the boundary parts of the lens and the shape of the lens is approaching the ideal parabolic form. The improvement appears on the Cornu spiral, which is now practically a straight line. At the same time, the focal length is enlarged and the probability pattern is getting wider (the lens gives a deep sharp image in the camera).


Fig. 16. Focus is point at which probability reaches maximum (lens.exe)

A dispersion at the boundary of air and water/glass manifests itself by a separation of colours in incident light, as we discuss it in the section Dispersion. In the case of lens, dispersion separates the focuses in such a way that the focus of higher frequency light (blue) is closer to the lens then that of the lower frequency light (green, red). Shifting the focuses, labelled as aberration of an optical system, appears as coloured boundaries in colour photographs.

With the program lens.exe we can simulate a situation which cannot be observed in nature. We can compute the probability pattern without existence of the dispersion. In this case no separation of the focuses takes place even by spherical lens. Only width of the probability pattern is influenced by the frequency of the light.

Dispersion

By the word dispersion we usually denote a separation of light to its frequency components. The wave theory explains this separation by a frequency dependence of the material’s refractive index n, which is expressed as a ratio of the speed of light in vacuum c0 relative to that c in the substance: n = c0/c.

In our computer program we simulate the dispersion phenomenon on the bases of the sum-over-paths method, where photon is the basic particle of the light, which moves at the speed c0 of light in vacuum. Therefore, the light speed decrease in materials is the result of a zigzag movement of the photons. In the section Point-to-Point paths, the refractive index is expressed as a ratio of the mean length L of the zigzag path between two points relative to the straight-line distance L0 of the considered points: n = L/L0. This equation is used in the program for computing the length L in a matter (glass) with given refractive index n and the straight-line distance L0 of initial points on an air-glass boundary and the terminal points on screen.


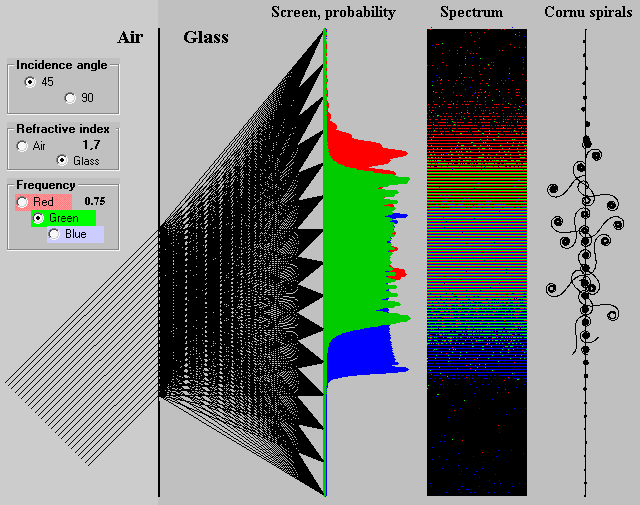
Fig. 15. Dispersion (dispersion.exe)

The Fig. 15 illustrates the dispersion. A mixture of three monochromatic lights (red, green and blue) is accident on the air-glass interface at a not-perpendicular angle. Separation of the R, G, B components is depicted by their interference patterns in corresponding colours. Spectrum illustrates the light, as it would be seen on a screen. On the right-hand side of the Fig. 15 there are shown some Cornu spirals, which have formed the green interference pattern at the relevant points. Interference patterns in Fig.15 confirm the frequency dependence of the refraction effect. Blue light is refracted more than the green and the red ones

Total reflection

When light crosses a boundary between materials with different refractive indices, the light is partially refracted at the boundary and partially reflected. The total reflection is a phenomenon that happens when a ray of light strakes the medium boundary at an angle larger than a particular critical angle with respect to the normal to the surface.

The figure and program in section Refraction illustrates Snell’s law from the QED view angel. Snell (1591-1626) has derived his law on base of the wave theory. It relates indices n of the refractive index to the directions of propagation in terms of angles to the normal to boundary of two mediums: nαsinα = nβsinβ. In this formula, nβ and β are related to an optically slow medium (glass, water) and nα with α to the fast one (vacuum, air). The refractive index for vacuum equals to 1 by definition and to 1,00029 for air. For both is relevant the simplified equation sinα = nβsinβ.

Incidence angle β for which α = 900 is labelled as the critical angel of the substance. For water n = 1,33 and the critical angle is about β = 480. For the some glasses n = 1,55 and β = 420. The Snell’s law sinα = nsinβ has no solution for an incidence angle β greater than the critical one. The boundary in this case behaves as a mirror and rays are reflected according to the law: the angle of incidence equals to the angle of reflection.

Program reflection-total.exe simulates the refraction, reflection and the total reflection for substances water/glass on one side and air (vacuum) on the other side (Fig. 14) of the boundary. These phenomena are visualized by an interference pattern on three line detectors: the vertical Detector V, horizontal Detector H in air and horizontal Detector S in water/glass. The parallel paths of photon in water/glass are incident on boundary at an angle β to normal. In other words, the boundary is illuminated by a plane wave of monochromatic light. The white line shows some light rays as they are calculated according to the geometric optics laws.


Fig. 14 a) refraction rays, b) reflection for critical angle b, c) total reflection (reflection-total.exe)

Fig. 14a shows the situation where the incident angle b is smaller then the critical one. The photon paths in air are refracted and the photon causes an interference pattern on the vertical Detector V and the horizontal Detector H. Photon has also paths towards the Detector S in sub-stance, which results in interference pattern on this detector. It demonstrates that some part of light is reflected back to water.

Fig. 14b shows the situation where an incident angle b is the critical one. Some part of paths is directed to the vertical Detector V and photon creates here an interference pattern. Other part of paths has directions toward the Detector S and photon creates here an interference pattern as well. If some personification is allowed, we can say that a photon does not know whether it should continue its travel in the air or in the water.

Fig. 14c shows the situation where an incident angle b is greater then the critical one. The computation along the Detector H gives no interference pattern. This time only paths directed backward into water enable the photon to create an interference pattern on the Detector S and the Detector V. The incident light is totally reflected. This is the phenomenon, which makes the essence of several optical appliances; let us name optical fibers, which are used in endoscopes and telecommunications.

At last let us say, that all interference patterns are computed solely by the sum-over-paths method without using the Snell’s or reflection laws. Conversely, the interference patterns confirm the truth of these laws of geometric optics.

Refraction

To a man standing in water seem his legs to be shorter. The wave theory of light explains this impression by a lower light speed c in a substance relative to that c0 in vacuum. Quantitative formula for this decrease of speed is given by empirical refractive index n, which is expressed as a ratio of the speed of light in vacuum c0 relative to that c in the substance: n = c0/c. For air is the refractive index about n = 1,00029, for water 1,33 and for glass 1,55.


Fig. 13. Refraction (refraction.exe)

In our computer programs we simulate the light phenomena by the sum-over-paths method where photon is the basic particle of the light. By definition, a photon is a particle, which travels at the speed of lightc0 in vacuum. So the light speed decrease in materials is the result of the zigzag movement of the photon. In the section Point-to-Point paths, the refractive index is expressed as a ratio of the mean length L of the zigzag path between two points relative to the straight-line distance L0 of the considered points: n =L/L0.

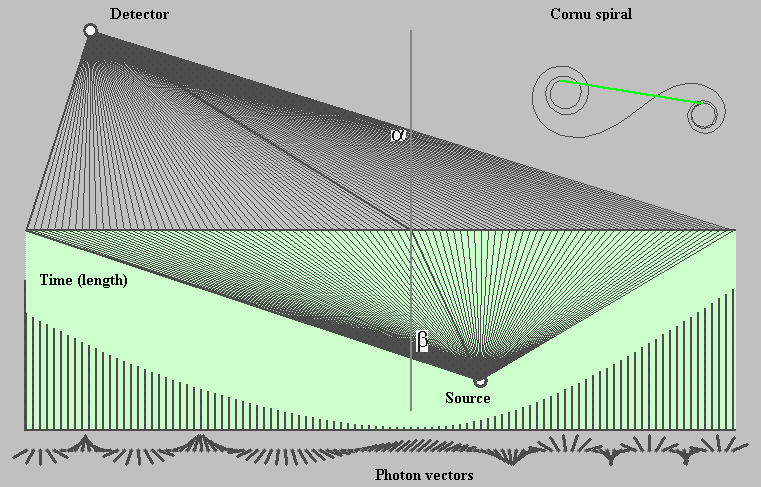
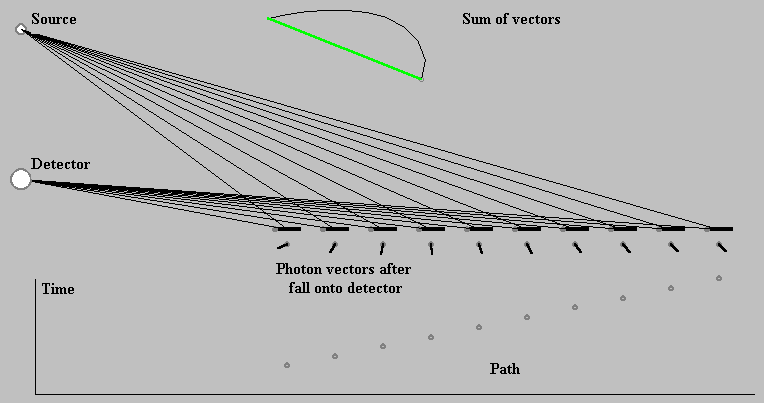
Fig. 13 illustrates the refraction effect as it is simulated by the program refraction.exe. Source of the light is in water (substance). The paths of photon are shown as straight-line segments. In calculation of the path length from the source to the detector, the lengths of segments in substance is multiplied by the refractive index n. The graph in the bottom of Fig.13 shows time photon needs to reach the detector. Measure for time calculation is the length of the path. Below the graph, photon vectors are depicted in direction as they ended on the detector over relevant paths.

In the vicinity of the shortest time the directions of the photon vectors are nearly the same because the timing of their paths is nearly the same. It is evident that photon vectors in the vicinity of the shortest time make the major contribution to the endpoints distance of the Cornu spiral. It is right to say that the light goes where the time is the least.

The sum-over-paths method reveals the Fermat’s least time principle of classic optic (Fermat Pierre 1601-1665). The least time path is shown in the bold line in Fig. 13. The figure illustrates as well the Snell’s law which relates the refraction index n of the two media to the directions of propagation in terms of the angles to the normal n = c0/c = sinα /sinβ . It means that a medium with greater refractive index bends the light ray towards the normal to the boundary between the two media.

Reflection

Here we discuss the well-known phenomenon of reflection based on the sum-over-paths method. The approach is illustrated in the Fig. 10 where paths are drawn, along which photon can travel from source to detector. The straight-line segments represent all paths between point source via mirror point to the detector in accord with the analysis in section Point-to-Point paths.

The graph in the lower part of Fig. 10 shows the time, which takes a photon to go from the source to a point on the mirror and then to the detector. In the sum-over-path method the meas-ure for time is the length of the path. Below the mirror there are shown photon vectors after reaching the detector. Sequence summation of these vectors from left to right results in a nice Cornu spiral whose starting and ending points define the vector sum. Square of vector sum length is proportional to a probability that a photon starting from the point source falls onto the detector.


Fig. 10. Reflection on mirror (reflection-mirror.exe)

It is evident; vectors, whose direction is nearly the same, make the major contribution to the vector sum. This happens to be in the vicinity of the least time that a photon needs to land on the detector. By the way we have derived one of the postulates of geometric optic learnt in the elementary school: the angle that an incident ray makes with the normal is equal to the angle that the reflected ray makes to the same normal.

From the Cornu spiral shape one might conclude, that parts of mirror at large distance from the mentioned normal play no role in the reflection phenomenon. Nevertheless, in the section Diffraction it is shown that they play principal role when parts of the mirror are scraped away at regular intervals.

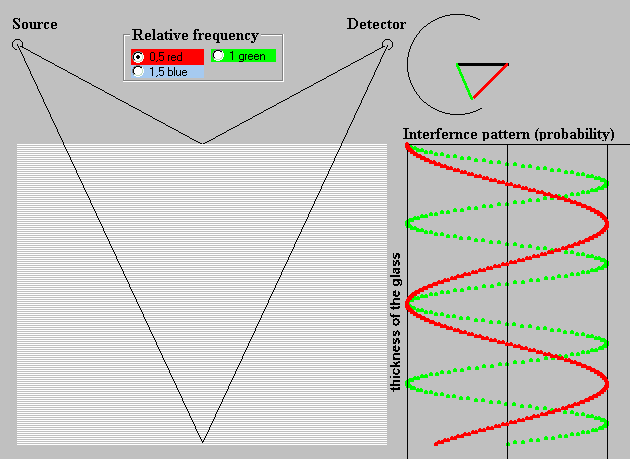
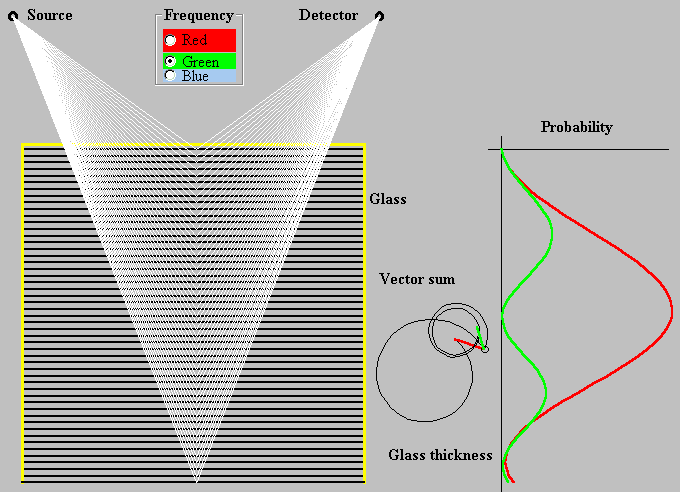
In a television show the question “where has the light gone away when there is dark?” the popular actor Horniček answered, “the light has anywhere gone away, it is only not seen”. Here we confirm the truth of Horniček’s answer by simulation the reflection phenomenon on a slightly thicker sheet of glass. Neglecting rather complex process that takes place in the bulk of glass, we suppose that only the front and the back surfaces reflect light. The probability pattern shown in Fig. 11 takes zero value for some thickness of the glass. That means that for a given monochromatic light there is dark for a detector even thought the source shines with full power.

The computation technique of interference pattern is the same as always. We should repeat the computation process for a mirror reflection, now for the front and the back surfaces of the glass. Nevertheless, we make use of the above got results and we compute the sum only over the paths whose angle of incidence equals to the angle of reflection.


Fig. 11. Double sheet reflection (reflection-double-sheet.exe)

At the top in Fig. 11 the sum (green) of two vectors are shown when a photon reaches the detector. The first of them (black one) is associated with the path that goes via point on the front surface of the glass. It does not change with varying thickness of the glass. The second vector (red one), belonging to the path via point on the back surface, rotates as the glass is getting thicker. Interference pattern for the “red” and the “green” frequencies is shown at the right-hand side in Fig. 11. Due to the above-mentioned neglecting processes in the bulk of glass, the maximum of the patterns does not alter with the frequency.

Now we are going to take into account the scattering of the light in the bulk of glass caused by a collision of photon with electrons, of course in a maximally simplified form. Atoms in glass are scattered randomly, but for the sake of simplicity we suppose that they are aligned in a flat sheets parallel to the glass surface. Their number increases proportionally to the thickness of the glass. Each sheet reflects the photon alike the back surface of glass described above.


Fig.12. Reflection with scattering in bulk of the thin glass plate (reflection-thin-glass.exe)

The probability of a photon falling onto the detector is shown in Fig. 12. Photon scattering in the bulk of glass causes that the probability maximum is frequency dependent. Photon scattering in the glass (substance) reveals the interference phenomenon that is in specific circumstances referred to as a dispersion, refraction, etc. In the wave theory, these phenomena are associated with a decrease of light speed in substance relative to its velocity in vacuum.

Diffraction

We illustrate the diffraction principles by means of the sum-over-paths method in Fig.8. The detector registers the light of the source if the frequency of the light matches the spacing of reflective pieces in the grating. This matching manifests itself in photon vectors orientation pointing in the mainly same direction for all paths from the source to the detector. The sum of the photon vectors results in a fairly long vector. Its length square indicates the probability that a photon emitted by the source falls onto the detector. In spite of the fact that the photon requires different times for its travel along particular paths, its vector is pointing almost in the same direction for all paths.

For frequencies of the light not matching the grating, the photon vectors are oriented in different directions and the vector sum is short. Alike short resultant vector arises in case that instead of grating an ordinary mirror is reflecting.


Fig. 8. Diffraction grating principle (diffraction-principle.exe)

The interactive program diffraction-grating.exe simulates the diffraction phenomenon in more details (Fig. 9). In this case the grating takes a form of evenly spaced slits in a diaphragm. Depending on the number of the slits the grating is labelled as a double slit, multiple slits (3-4. slits) and a diffraction grating (we have 20 slits in our program). Using the program we can view the forms of interference pattern depending on number of the slits and the frequency of the monochromatic light.


Fig. 9. Diffraction grating (diffraction-grating.exe)

Interference pattern manifests itself in periodically spaced “packages” of high value. Remember that the interference pattern represents the probability that a photon strikes the detector at a given point; it means the illumination intensity. Interference pattern is a kind of picture of the grating. The spacing of the packages is increasing when the light frequency is decreasing.

The diffraction grating, among other technical and scientific applications, is the tool for separating colours in incident light, as is it illustrated by a sketch in the Fig. 9. Equal mixture of red, green and blue lights is an incident at the grating. On a screen opposite the grating, this compound appears to be white. Red component is more separated on the screen than green and blue ones, because the red light has a lower frequency.

Coloured patterns seen on a compact disc (CD) illuminated by sunshine are a product of the diffraction on the grid. Nominal track separation on a CD is 1.6 micrometers. Red light takes wavelengths in the range of 0,6 – 0,74 micrometers and blue light does 0,435 – 0,5 micrometers. Separation of red and blue lights on the CD is several thousand times greater then the track sepa-ration on the CD. The diffraction phenomenon acts this time like a magnifying glass.

The program diffraction-grating.exe enables us to observe an increase (decrease) of the distance D between the interference pattern packages depending on the lower (higher) frequency. Into the program there is not implemented the possibility to change the slits spacing d, as it is possible to achieve all interference pattern forms using the frequency n selection. For the quoted variables is applied a simple relationship D = m/d ν, where m is a constant. This relationship can be easily derived with help of trigonometric relations. However we prefer physical arguments.

Nature, as well as our simulation programs, does not recognise meter or micrometer as a measuring unit. For them the wavelength of light is a natural unit or, speaking in QED language, the distance travelled by photon during one cycle of its frequency ν. With increasing (decreasing) the spacing d we have to decrease (increase) the frequency ν to achieve the unchanged form of the interference pattern.

In the limit case, when d = 0, the grid turns to a wide aperture and the distance D takes an endless value. The diffraction phenomenon is now labelled as aperture diffraction. We can look into its features using the program diffraction-aperture.exe.

© This website is under Copyright.   Running on webhosting service ToJeOno.cz   Group of Wikina website