Warning: Use of undefined constant THEM_TEMPLATEURL - assumed 'THEM_TEMPLATEURL' (this will throw an Error in a future version of PHP) in /www/wikina.de/wikina.de/domains/qed.wikina.org/wp/wp-content/themes/panorama/functions.php on line 5

Warning: Use of undefined constant AP_LAYOUT - assumed 'AP_LAYOUT' (this will throw an Error in a future version of PHP) in /www/wikina.de/wikina.de/domains/qed.wikina.org/wp/wp-content/themes/panorama/functions.php on line 38

Warning: Use of undefined constant AP_LINKCOLOUR - assumed 'AP_LINKCOLOUR' (this will throw an Error in a future version of PHP) in /www/wikina.de/wikina.de/domains/qed.wikina.org/wp/wp-content/themes/panorama/functions.php on line 39

Warning: Use of undefined constant AP_HOVERCOLOUR - assumed 'AP_HOVERCOLOUR' (this will throw an Error in a future version of PHP) in /www/wikina.de/wikina.de/domains/qed.wikina.org/wp/wp-content/themes/panorama/functions.php on line 40

Warning: Use of undefined constant AP_HEADERIMAGE - assumed 'AP_HEADERIMAGE' (this will throw an Error in a future version of PHP) in /www/wikina.de/wikina.de/domains/qed.wikina.org/wp/wp-content/themes/panorama/functions.php on line 41
QED | The Strange Theory of Light - Part 2

Kategorie: QED

Interference

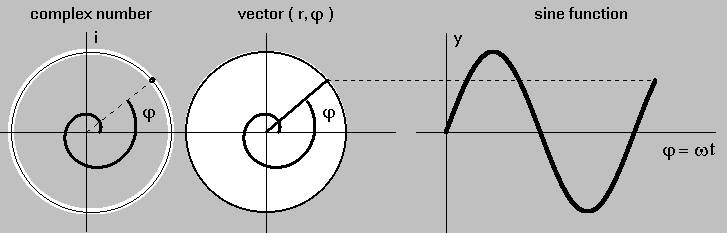
Newton (1643-1727) advanced the corpuscular theory of light. But his theory could not explain the interference phenomenon. Huygens (1629-1695) advanced the wave theory of light and Young (1773-1829) reinvigorated it against the Newton’s particular theory. But even this theory cannot deal with interference of the smallest energy quantum – photon. QED, using the photon theory of light, innovates the idea of corpuscle, which in the Feynman’s strange theory of light possesses a graphical form of a rotating photon vector over paths.

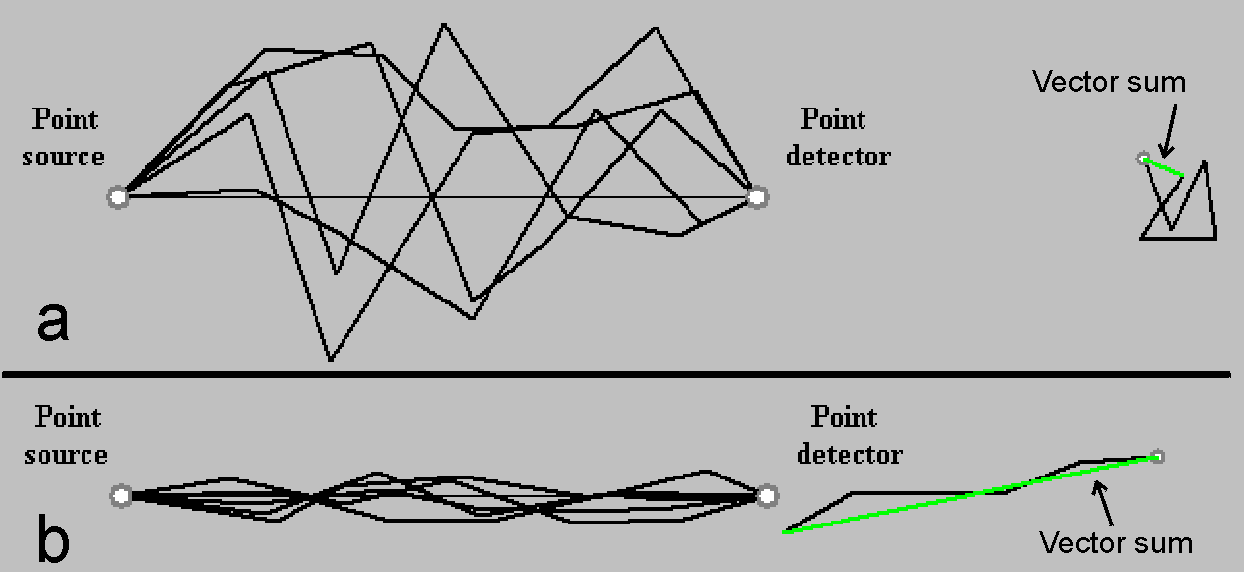
Based on the sum-over-paths method, we approach interference by simulation of the Young’s double slit experiment (Fig. 5). A photon emerged from a point source travels along all alternative paths trough two slits A and B to a detector point. According to analyses shown in the previous section Point-to-Point paths, it is possible to reduce all paths to straight-line segments. In this concept, photon hits the detector point by travelling only along two alternative paths trough A and B slits. The photon vector on the detector point exhibits an angle, which equals to the path length multiplied by the photon frequency. Probability of hitting the detector by the photon in a particular point is proportional to square of the vector sum length. A configuration imaging the probability along the detector is called interference pattern.


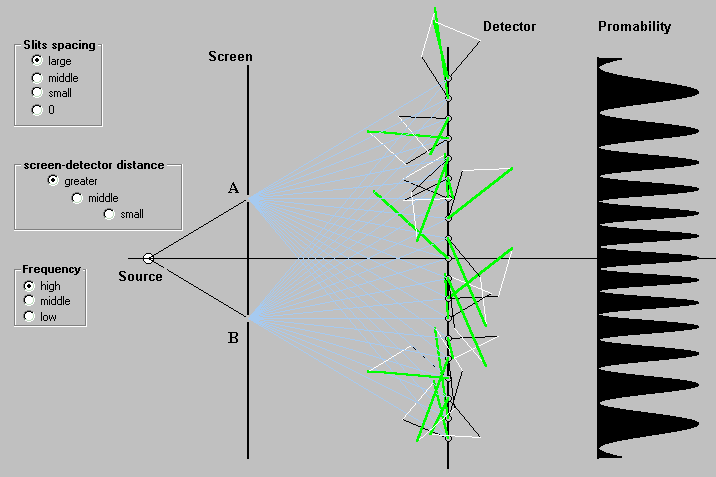
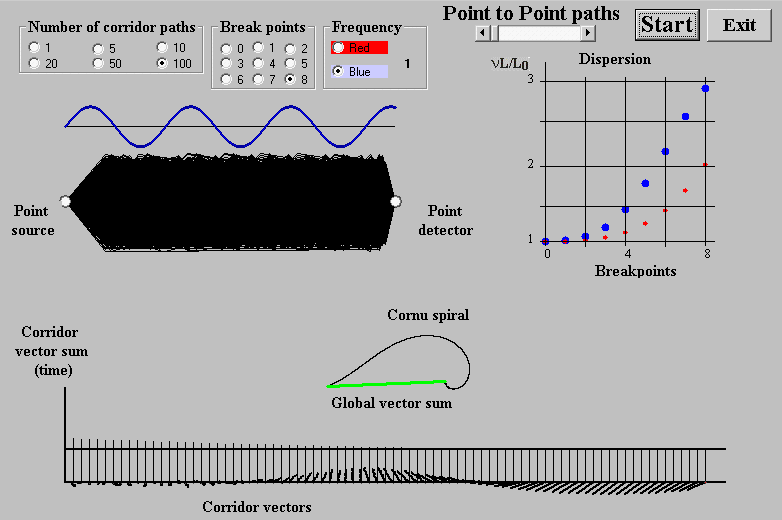
Fig. 5. Double slit interference (Interference.exe), (interference-detail.exe)


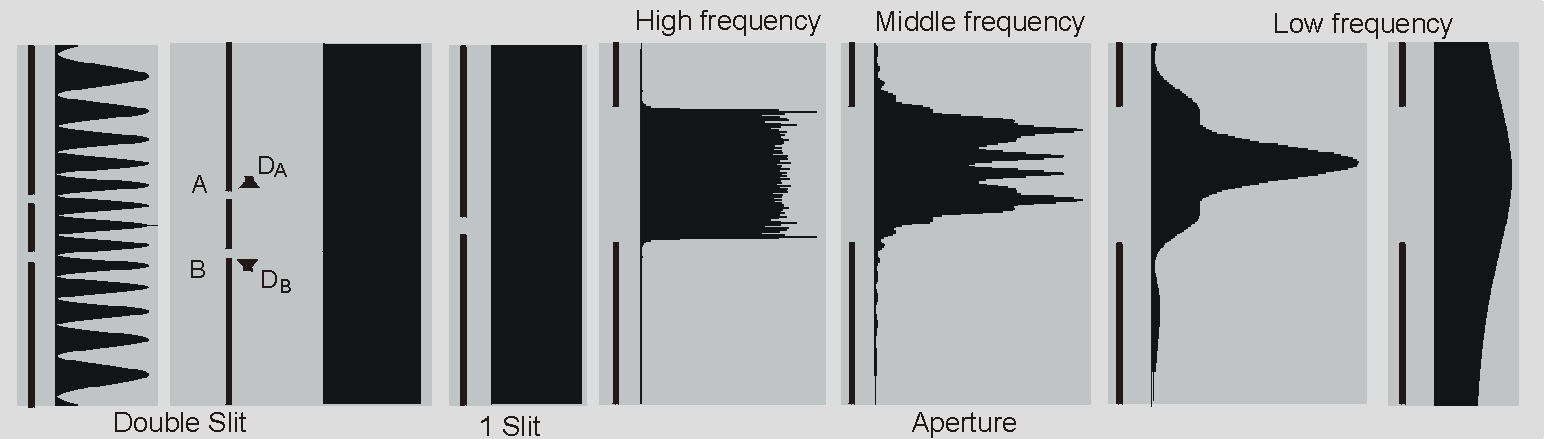
Fig. 6. Interference pattern (Interference.exe), (diffraction-aperture.exe)

Interference phenomenon at a slit, which is large with respect to the light wavelength, is referred to as diffraction at the aperture. Some alternatives of interference patterns are shown in Fig. 6 with respect to the light wavelength (diffraction-aperture.exe). Their form is characterized by concentration to a limited area unlike the double slit interference pattern that extents to infinity.

An aperture can be considered as plenty of slits aligned closely to each other. Therefore a photon has ample paths to travel to detector. In the section Diffraction we approach the aperture diffraction as diffraction on a grid with spacing limiting to zero. Interference is a phenomenon that exhibits itself in several forms, which are in specific circumstances labelled as diffraction, dispersion, reflection, etc.


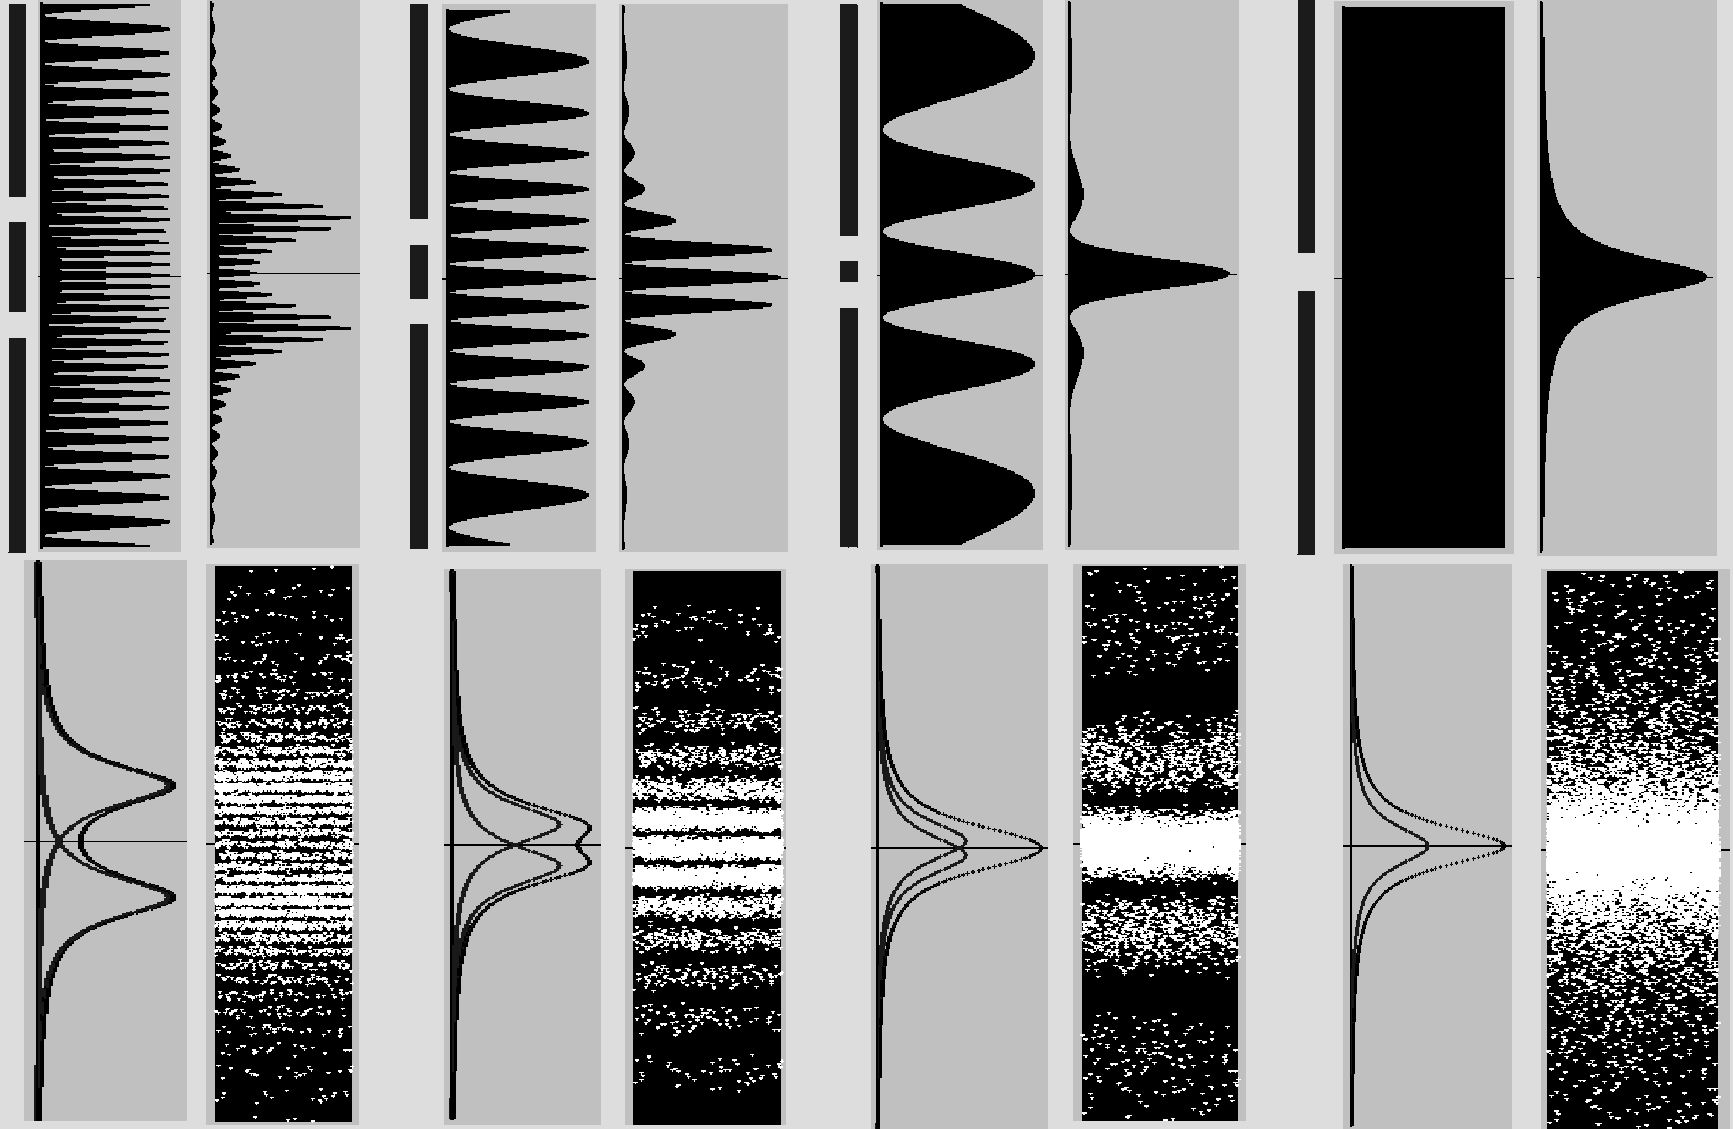
Fig. 7 Light pattern on device screen related to interference pattern (Interference-light.exe)

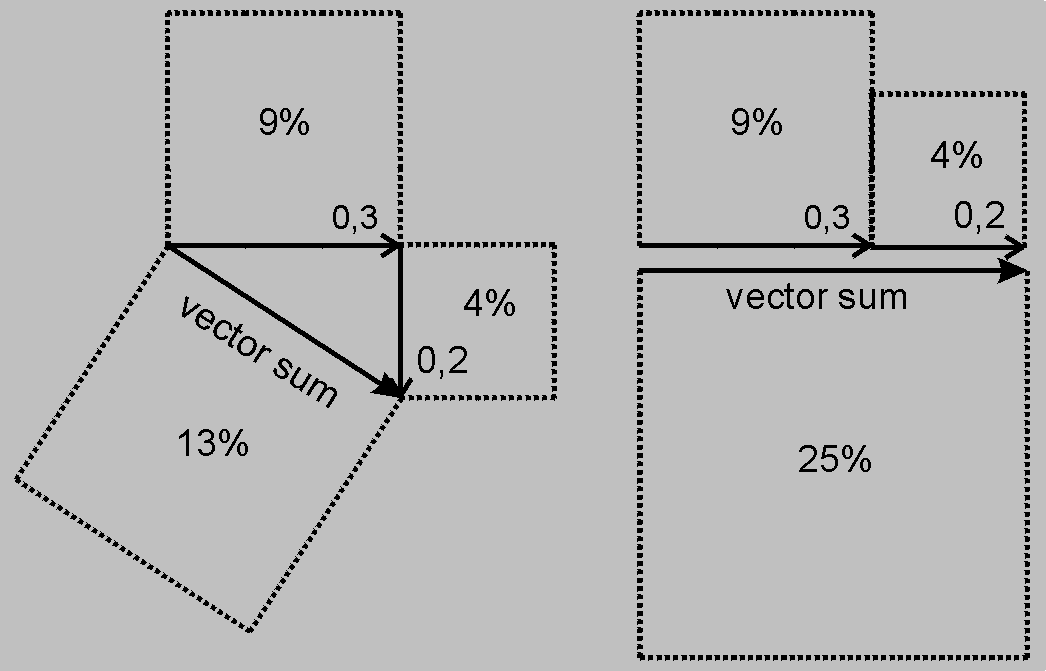
No device displays the double slit interference pattern. Devices visualise the photon density hitting the screen (Fig. 7). When a source emits photons uniformly in all directions, their density decreases with square of the source distance. The density of photons attaining the screen is proportional to P/R2, where P is the interference pattern value (probability) on screen and R is the distance between the slit and the attained area on the screen. Separate graphic shapes of P/R2 for both slits are shown together with their sum, which in final effect determines the density of photons hitting the screen.

Point to Point paths

We are going to calculate the probability that a photon, which emerged from a point source, falls onto a detector point. According to the QED method we ought to evaluate all alternative paths, as we do not know which of them the photon travels over. Graphically the photon is represented by a vector, which rotates along the path at a frequency of light (of photon) ν. The final angle of the vector on the detector is the product of path length and frequency ν. This vector is added to the sum of vectors that travel along other paths. The result of adding of all these vectors is the global vector sum.

We are not able to explore all alternative paths. However, in our global-vector-sum.exe program we show that a straight line connecting the point source with the detector point is the one, which can represent all paths. The path is formed of straight-line pieces con-nected to each other in breakpoints (Fig. 3). In the program, their number can be selected and a random number generator determines their positions. The breakpoint positions are restricted to corridors whose width is step-by-step getting narrower and limiting to the straight-line. For a narrow corridor the vector sum of all paths is much longer than that for a broad one.


Fig. 3. Corridor paths and they vector sum (corridor-vector-sum.exe)


Fig. 4. Point to point paths (global-vector-sum.exe)

Average path lengths of the particular corridors are aligned to graph in the lower part of the Fig. 4. The horizontal straight-line exposes the source to detector distance. The corridor vectors sums are displayed along the horizontal axis of the graph. As the corridor is getting narrower, vectors point practically in the same direction, which means that mainly they contribute to the length of the global sum of vectors of all corridors (Cornu spiral). In other words, all paths closely plaiting to the straight-line path determine the global vector sum and for an observer it seams like that the light spreads as straight-line rays. In all our programs and texts, speaking about vector sum of pats from a point source to a detector point, we have in mind the global vector sum in Fig. 4.

The commutative law holds for vector adding. It means that the vectors can concatenate in any sequence without changing the resulting vector: the vector sum that connects the initial point of the first vector to the end of last one. The graphic image of the vector sequence is irrelevant, it only reveals the adding sequence. If summation order is well arranged, the vector sequence takes a nice spiral labelled Cornu spiral. The global sum vector in Fig. 4 also connects the initial point to the terminal point of Cornu spiral, even thought if it is far away to be like a spiral. We will see nice Cornu spirals in the next sections.

In vacuum there are no obstacles (atoms), which cumber photon in his free travel. The program simulates this idea for zero number of breakpoints. The length of a straight-line path between the source and the detector is L0. For a growing breakpoints number the path length L is getting longer and the global vector sum is getting shorter due to the zigzag path. The L/L0 ratio is a material constant. Its multiple by frequency of the light is labelled as the refractive index n = νL/L0 = νV0/V, where V0 is the length of global vector without breakpoints, and V with them. Schoolbooks refer to refractive index as to a ratio of the speed of light c0 in vacuum relative to that c in the substance n = c0 /c. However, in a substance a photon moves at the speed c0, as defined, but along a zigzag path, which takes more time to reach the detector. This is a simplified view on refractive index related to the Fig.3 and Fig.4. Feynman explains refractive index more comprehensively in his lecture http://feynmanlectures.caltech.edu/I_31.html.

Diagram in the upper right-hand corner in Fig. 4 illustrates the refractive index νL/L0 of blue and red lights. One period of the sinusoid, shown over paths, depicts the wavelength of the selected colour light. The frequency of the blue light is twice higher with respect to red, so its wavelength is two times shorter. The material constant L/L0 is represented by breakpoints at the horizontal axis. The frequency dependence of the refractive index is labelled as dispersion, which manifests itself always when a light crosses the boundary of substances with different refractive indexes. The phenomenon of dispersion makes it felt in several forms, as can be seen in further sections.

Published values are absolute refractive indices na as refractive index of vacuum is assumed 1 per definition. In our notation it takes the form na = νL/L0/νLvc/L0= L/Lvc, where Lvc is the average length of photon path in vacuum. We have derived an important relation L = naLvc, which we use in our programs for simulation of diffraction in specific situations. For the visible light most transparent media have indices between 1 and 2. A few examples are given in the table below. These values are measured at the yellow light with a wavelength of 0.589 micrometer. Germanium is transparent and has the refractive index of about 4 for radiation in range of micrometers, making it an important material for thermo imaging optics.

Matter Refractive index na=c0/c Remark
Vacuum 1 per definition
Air 1.000293 yellow light
Water 1.333 yellow light
Glass 1.6 to 1.9 yellow light
Diamond 2.42 yellow light
Silicon 3.96 yellow light
Germanium 4 infrared radiation

Photon travels over a zigzag path even in vacuum; after all, it reaches any point of the space with a certain probability. Because the absolute refractive index is defined relatively to that of vacuum, we assume that the average length of paths in vacuum equals to the straight-line distance from the detector point to the source point: Lvc = L0.

Principles

Feynman’s strange theory of light constructs its conclusions on following three principles

Principle A
Photon is an elementary particle, the quantum of electromagnetic radiation. It is basic unit of light.
Principle B
We are able calculate only the probability of reaching designated point in space by a photon emanated from a point source.
Principle C
To compute the probability, we must take into account all alternative paths
between point source and the given point in space.

Photon as the quantum of electromagnetic radiation is defined by two attributes of its existence

a) Photon travels at speed of light about c0 = 3.108 [m/s].

b) Photon’s energy is e = h.ν, where h = 6,6.10-34 [Js] is Planck’s constant and n is frequency of light.

Fig. 1. Three representations of sinusoid (sinusoid.exe), (vector-sum.exe)

Light is an electromagnetic radiation in the visible range of wavelengths; nevertheless, conclusions derived by strange theory of light are valid for any wavelength in the range from the long radio waves to X-rays. When one says frequency, we have in mind a sinusoidal oscillation y = sin φ, which can be shown in three forms (Fig. 1). The vector form, defined by vector length (magnitude) r and its phase angle φ, is applicable in a case where a result of two or more parallel events is calculated. Adding two or more vectors gives the sum vector (resultant vector of summation), which connects the initial point and the terminal point of the vector addition (Fig. 2).

Fig. 2. Probability equals squared length of the sum vector

The points in complex number plane define the sine function by the imaginary part in the Euler’s formula reiφ = r(cosφ + i sinφ). This form is suitable for serial event calculation when two sine functions are to be multiplied. Multiplication of two or more exponential expressions yields a vector whose length is the product of involved vectors magnitudes and its phase equals to sum of involved vectors phase angles.

Below we indicate the rules on which the calculations in our programs are based. If you ask why they are so strange, the answer is that they are part of the Feynman’s discovery, which yields to matching the calculation of results with experiments.

Rule 1. Photon is visualised by a vector, which rotates at a light frequency during its travel along the path.
Rule 2. The phase angle of the vector in target point is the product of the frequency n and the path length L from point source to target. The length of the path is the measure for time in our calculations.
Rule 3.The sum vector (resultant vector) in the target point comes from the sum of vectors over all alternative paths.
Rule 4. Probability of photon falling into target equals to square of the sum vector length.

One question still remains; how can we take into account all alternative paths? We are going to give an answer to it in the Point-to-Point paths section.

Computation approach to the above given rules is known as “the path integral method”, “the sum over histories method” or “the sum over paths method”, as we prefer to call it in our text. An advantage of this method consists of its illustrative nature and no necessity of using complex mathematics. No differential equations, no operators, etc. are needed. In our animation programs we make do with adding vectors and computing the length of path compiled from straight lines. The sequence of adding vectors is for the sum of vectors irrelevant since summation obeys the commutative low; nevertheless, systematic computation sequence yields nice Cornu spiral visualising the calculation progress.

Home

© This website is under Copyright.   Running on webhosting service ToJeOno.cz   Group of Wikina website