Holography
Computer-aided simulation contributes to understanding Nature’s performance of its magic, as in the simulation we can follow the process step by step. The QED method makes use of the interference as the only phenomenon, which under specific circumstances is labeled as diffraction, refraction, reflection, dispersion and so on. The
In the framework of the wave theory, the monochromatic light wave is characterized by an am-plitude and a phase of a vector in every point of the light field. The classic photography records only amplitude of the wave, therefore the viewer can perceive only a flat picture without parallax.
Holography is a method of recording the complete information about the light field at a photographic plate. It means that both amplitude and phase of the wave are stored. So recorded picture is the hologram with which an observer can view an image with all of its three-dimensional details with parallax. It is impossible to recognize the scanned object on the hologram, because it is a record of interference pattern of dark and bright lines of so high density, that the naked eye cannot even distinguish them.
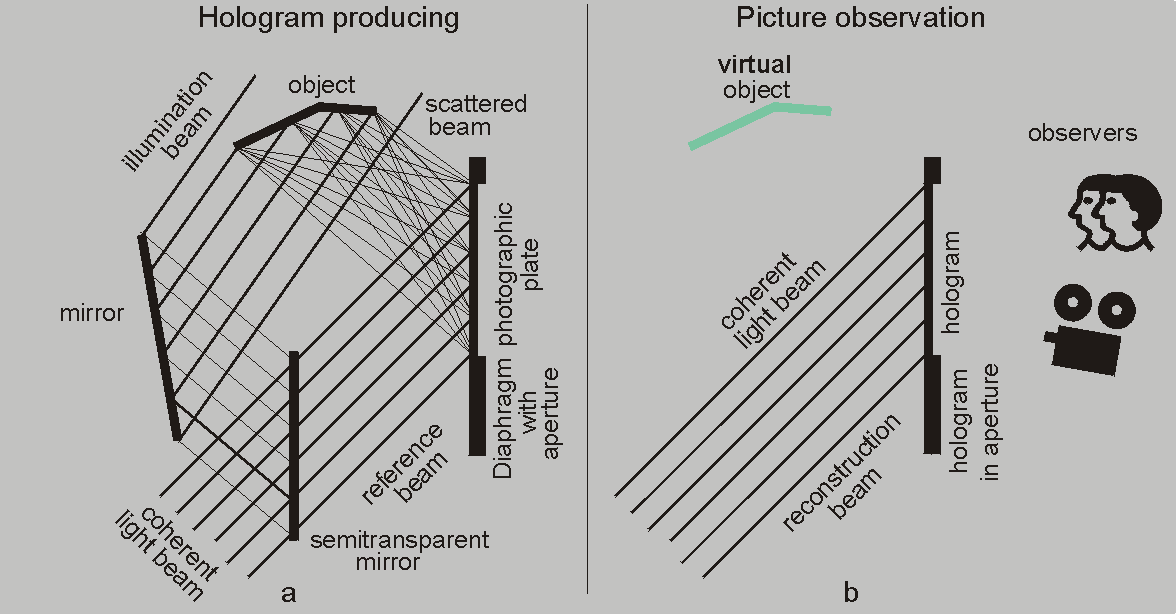
Fig. 18 illustrates the process of recording an object and viewing its virtual image through the hologram. An essence of the hologram recording involves the simultaneous illumination of the object with the illumination beam and the photographic plate with the reference beam of a coherent light. From the object scattered beam and the reference beam produce the interference pattern on the surface of a photographic plate – called as hologram. Laser is the best source of a perfect coherent light. The resolving power of the photographic plate must be extremely high – 5000 lines per millimeter for the visible light.

Fig. 18 Holography in framework of wave theory
A holographic image can be seen when the hologram is illuminated with a reconstruction beam, which reconstructs the light field and the observer or any photographic instrument can see and record the three-dimensional picture.
The framework of a hologram making shown in Fig. 18 is not the only acquisition; nevertheless it is a good example for an illustration of the holography by
After this short hindsight into the strange theory of light, we explain the
The object to be displayed is a small pill – one point in the area on which ends only one path. The photon vector explores all scattered paths from the object to the aperture. The reference paths also pass trough the aperture. The sum of all vectors produces an interference pattern at the aperture (Fig. 19b). When here deposited photographic plate is irradiated by many photons, then they produce alternating gray lines in a range of black and white proportionally to the interference pattern value. Hologram is the result of this process. Hereafter in our text the interference pattern at the aperture will be referred to as a hologram.
The photon vector continues its rotating travel from each aperture point to each point of the detector. These paths are not shown in Fig.19. The second bottom figure (Fig. 19c) illustrates the interference pattern of the aperture (without hologram) on the detector. This pattern represents the original light field, which is compared to the reconstructed one.
In the third bottom figure (Fig. 19d) we see a fragment of the interference pattern of the photon traveling over reference paths trough the aperture to the detector directly. It is the interference pattern of the aperture – similar patterns can we see in the programs
If a hologram is deposited into the aperture then the length of vector rotating along reference paths is modulated by the hologram. It means that the magnitude of the vector is multiplied by the value of the interference pattern in the aperture. The hologram acts as a

Fig. 19. Computer animated holography (holography.exe)
A holographic picture can be viewed even with a monochromatic light, whose frequency differs from that one which had been used for making the hologram. In this case the observer sees virtual object not only in altered colour, but also in another size. In case that the reference light frequency is lower (higher) then the hologram making light frequency, an observer records a grater (smaller) size picture. Hologram acts as a lens, which shows the size of the picture as greater (smaller) in proportion of the reference and the reconstructing light frequency. At the first glance it may seem that viewing the picture in an enlarged size with a longer wavelength is a paradox. Nevertheless holography together with technological progress provides the possibility that objects whose hologram has been produced with X-rays could be observed with visible light in three-dimensional views. Here we cannot model this phenomenon, but the following reasoning perhaps clarifies it.
We have drawings of an object where the dimensions are reported in centimetres L1. The drawing is an analogy to the hologram. Exactly according to the data in the drawings the object is reconstructed, but this time the measuring unit is the length L2 (meter/millimetre). In this case, the copy of the object has a larger (smaller) size compared to the original plan in proportion of L2/L1. The reconstructed object corresponds with the holographic picture.
The wavelength is the measuring unit in holography animation by the

Fig. 20 The frequency of light divers for hologram producing and for field reconstruction
Even a fragment of the hologram allows us to view the picture, naturally as though an adequately reduced aperture. Holograms in the Fig. 19 can be considered as a fragment of a larger hologram.
Holography is exercisable in a wide range of disciplines starting with art, security, science and so on. Holography dates from 1947. Dennis Gabor, the British/Hungarian scientist, had invented the holography while working to improve the resolution of an electron microscope. For inventing holography, Gabor (born in Budapest in 1900, original name Gábor Dénes) received the 1971 Nobel Prize.